How to check and list running processes in Linux
In Linux, processes are instances of running programs or commands. A single application can run multiple processes to handle different tasks. For example, a web browser creates separate processes for each open tab.
Listing these processes helps you maintain a healthy Linux system by identifying resource-hungry tasks and detecting potential bottlenecks.
This article will guide you through listing active processes in Linux using various commands. You’ll learn how to monitor your system’s performance effectively and troubleshoot issues before they impact stability.

Understanding processes in Linux
Linux processes can run either in the foreground or background.
Foreground processes directly interact with the user, like running a command in a terminal window. In contrast, background processes operate silently without requiring user input, such as system monitoring tools or file backups.
Some background processes function as list services – long-running tasks like web servers or network services that ensure continuous operation. Services are typically managed using built-in tools like systemctl instead of the commands we’ll cover in the next section.
Keeping track of both foreground and background processes lets you identify resource-intensive programs and prevent slowdowns or even crashes that may result from mismanaged system resources.
Listing processes in Linux
To list processes in Linux, use one of the five commands: ps, top, htop, atop, and pstree. Each command offers different detail and output formats. For instance, ps provides a momentary view of all processes, while top and htop dynamically sort them by CPU usage.
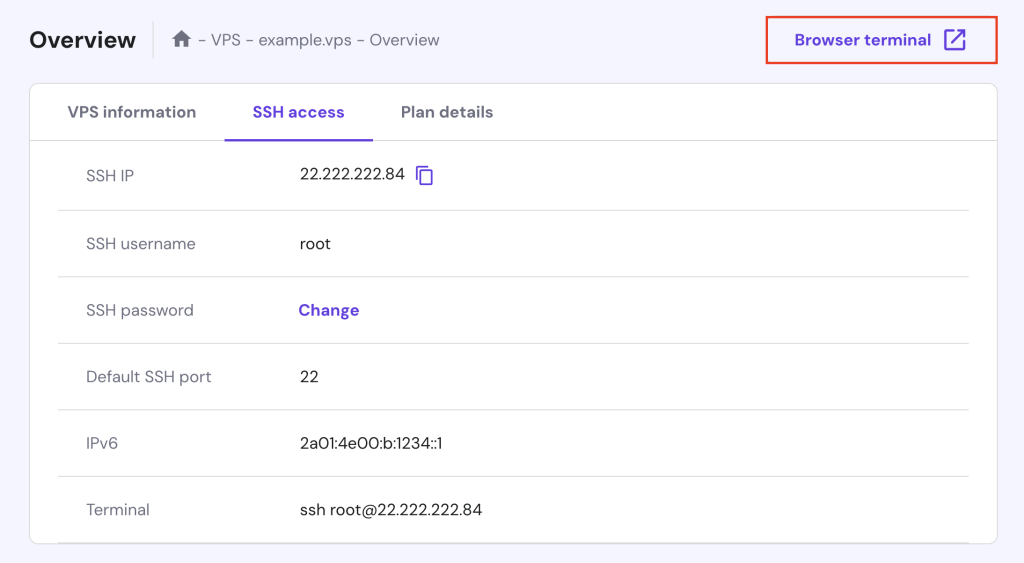
First, access your Linux system by opening a terminal or using an SSH client like PuTTY for a remote connection. For Hostinger VPS customers, our built-in Browser terminal offers a convenient way to interact with your server.
To use this feature, log in to your Hostinger account and go to VPS → Manage. Then, open the SSH access tab to view your credentials, hit the Browser terminal button, and enter your previously noted login details. You’re now ready to run commands directly from the browser.

Linux ps command
The process status (ps) command is one of the most popular tools for listing running processes in Linux. It provides a static snapshot of all processes at a given moment. By default, ps only shows the current user and session processes.
However, adding options like aux gives you more detailed information, including processes from all users and those not associated with a terminal. Here’s a breakdown of each option:
- a – see processes from all users.
- u – add more details like CPU, memory usage, and the process owner.
- x – include processes not associated with a terminal, such as system services.
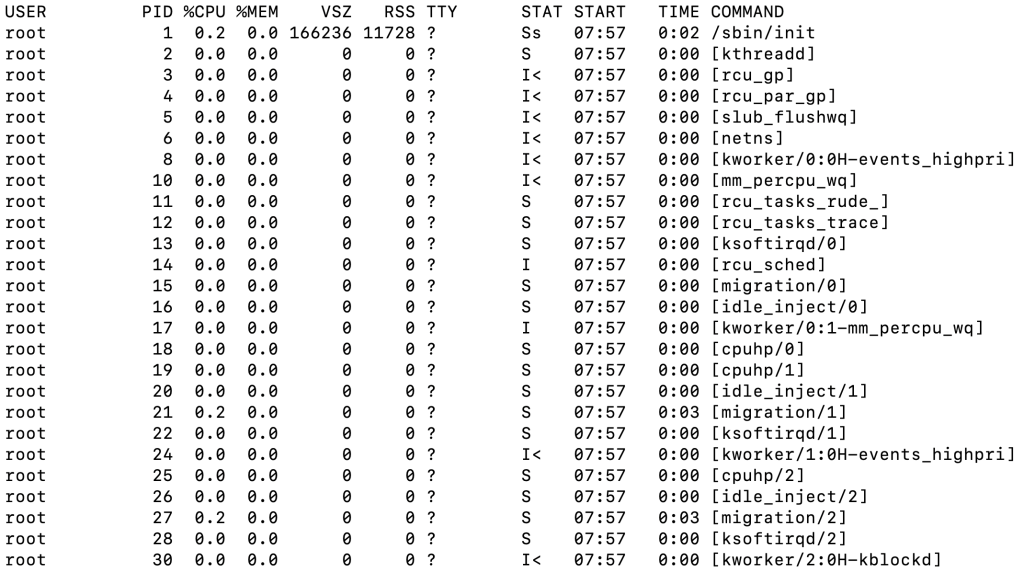
When executed, the ps aux command displays critical details such as the process identification number (PID), CPU and memory usage percentages, process start time, total CPU time used, and the command that launched the process.
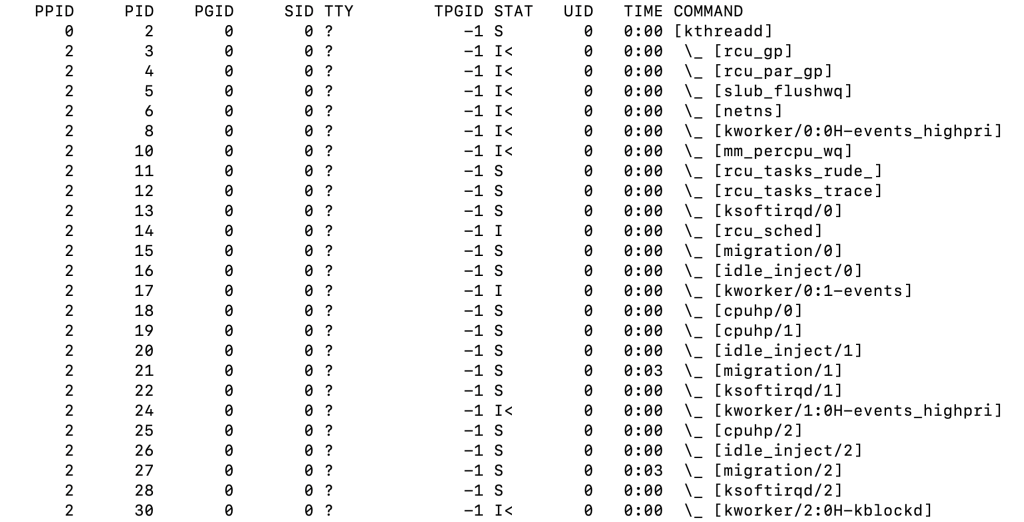
For a hierarchical view of processes, the ps -axjf command displays parent and child relationships between processes, which helps analyze dependencies.
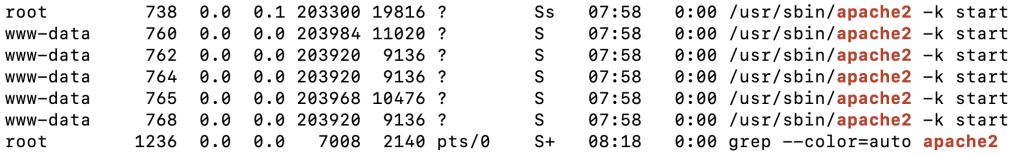
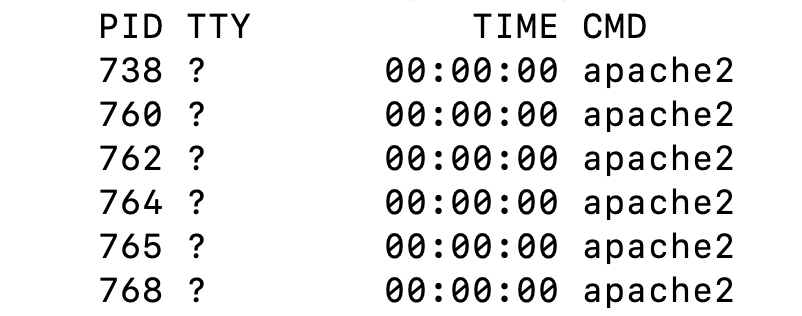
You can also filter specific processes using grep to narrow the output to a particular task. Here’s an example:
ps aux | grep apache2
Similarly, the ps -C process_name command filters processes by name, displaying all instances of that process and any child processes it has spawned.
Linux top command
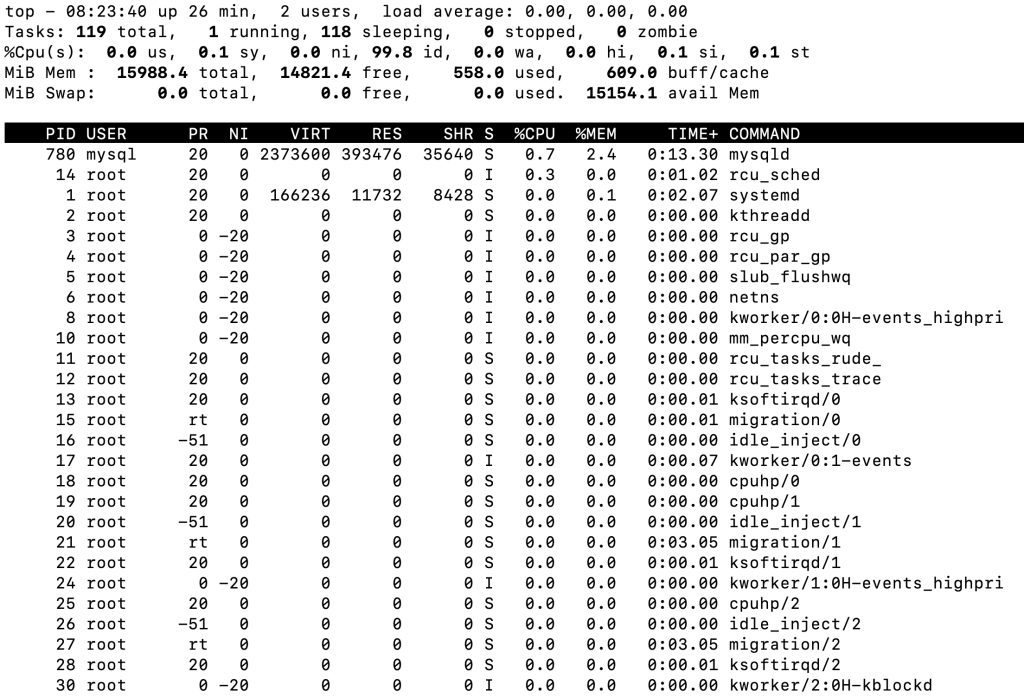
The top command is a real-time dynamic process viewer that lets you monitor system performance. Unlike the static ps command, top continuously updates, providing an ongoing view of resource usage, including CPU and memory consumption.
The real-time nature of top makes it particularly useful for identifying currently running processes. By default, it sorts processes by CPU usage, with the most resource-intensive ones listed at the top.
To see this command in action, type top in your terminal. You’ll then see an output similar to the following:
In addition to monitoring, you can interact with the process list using various keyboard shortcuts, including:
- k – terminate a process.
- r – adjust the priority of a process.
- m – sort processes by memory usage.
- n – sort processes by PID.
- d – change the refresh time interval.
- h – see the help window.
- c – see the absolute path of a process.
- z – enable color display for better visualization of active processes.
Remember that the keys above are case-sensitive, so be sure to disable caps lock. To exit the top command, press q.
Linux htop command
The htop command is a more interactive, user-friendly alternative to top. It provides a visually appealing and intuitive interface for monitoring system performance and managing running processes.
With htop, you can scroll vertically and horizontally to view the full list of processes and their complete command lines.
Additionally, this command has mouse support, making it easier to navigate, select, and terminate processes without manually entering PIDs. You can also adjust the priority of multiple processes with just a few clicks.
Since most Linux distributions don’t include htop by default, you’ll need to install it manually. On Debian-based distros like Ubuntu, you can do so by running the following command:
sudo apt install htop
Meanwhile, for RHEL-based distros like CentOS, execute this command instead:
sudo dnf install htop
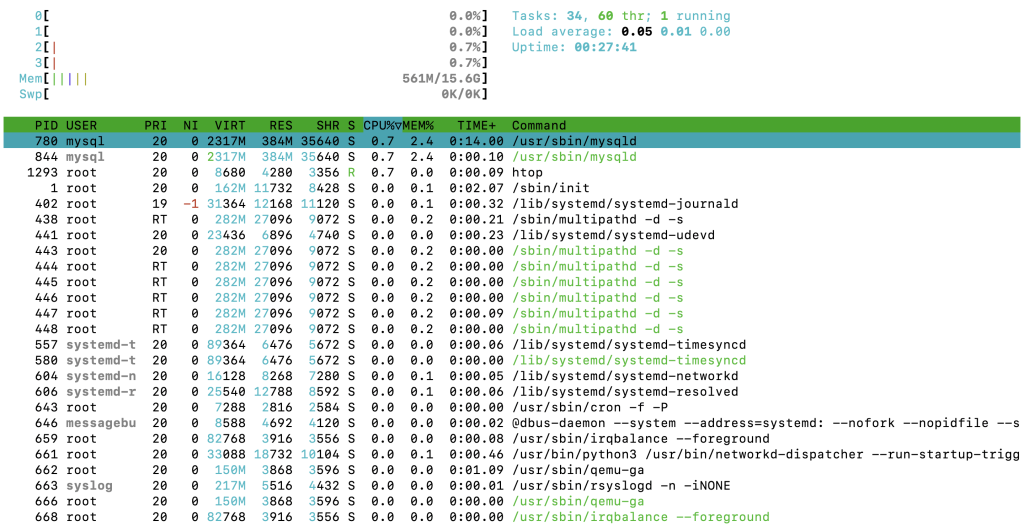
Once installed, launch the command by typing htop. You’ll then see a list of processes displayed in a more user-friendly format compared to top.
htop also offers various keyboard shortcuts for easier process management:
- F1 – display the help menu.
- F2 – open the setup menu.
- F3 – search for a process.
- F4 – filter processes by name.
- F5 – display processes in a tree view.
- F6 – sort processes by any column.
- F7 – decrease the process priority.
- F8 – increase the process priority.
- F9 – terminate a process.
- F10 – quit from htop.
Linux atop command
The atop command is a detailed process monitor that provides real-time information and historical logging for long-term analysis. Unlike top and htop, which focus primarily on real-time monitoring, atop offers additional insights through its logging capabilities.
One of the key advantages of atop is its ability to log and monitor system processes over an extended period – up to 28 days by default. This includes completed or terminated processes, allowing for in-depth performance analysis.
You can install atop using one of these commands, depending on your Linux distribution:
sudo apt install atop # Ubuntu or Debian
sudo dnf install atop # CentOS, RHEL, or Fedora
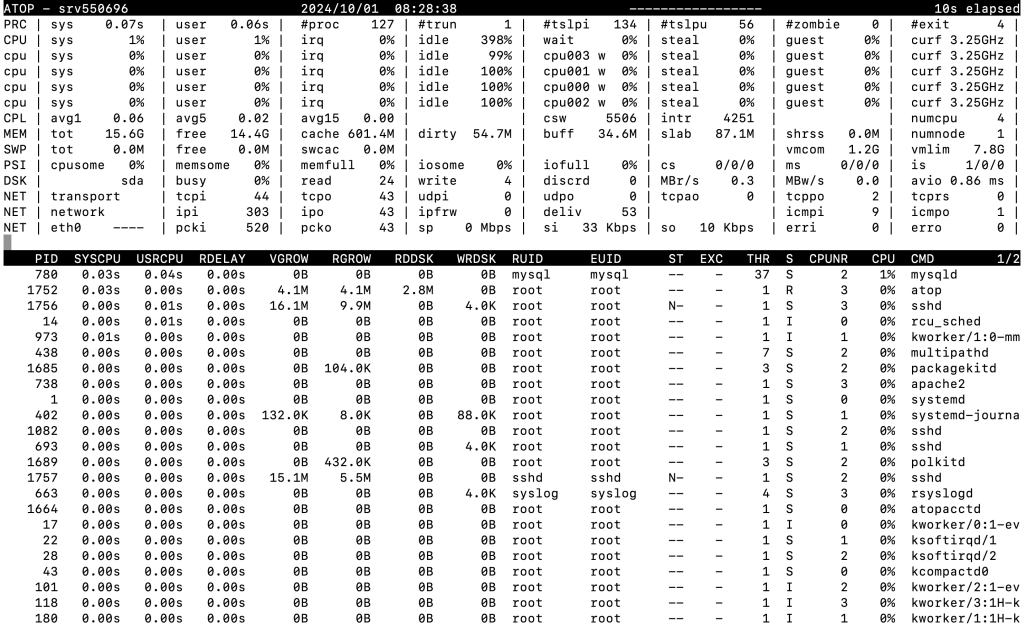
Once launched, atop displays resource usage for CPU, memory, swap, disks, and network at 10-second intervals.
The command also supports several options for more specific insights:
- -i – average-per-second total values.
- -a – active processes during the last intervals.
- -c – the command line for each process.
- -m – memory-related information.
- -d – disk-related information.
- -n – network activity.
- -s – scheduling details.
- -v – out various process data, such as PPID and user information.
- -y – individual thread information.
While using atop, you can sort processes by specific resources using the following shortcut keys:
- a – the most active resources.
- c – CPU usage.
- d – disk activity.
- m – memory usage.
- n – network activity.
Linux pstree command
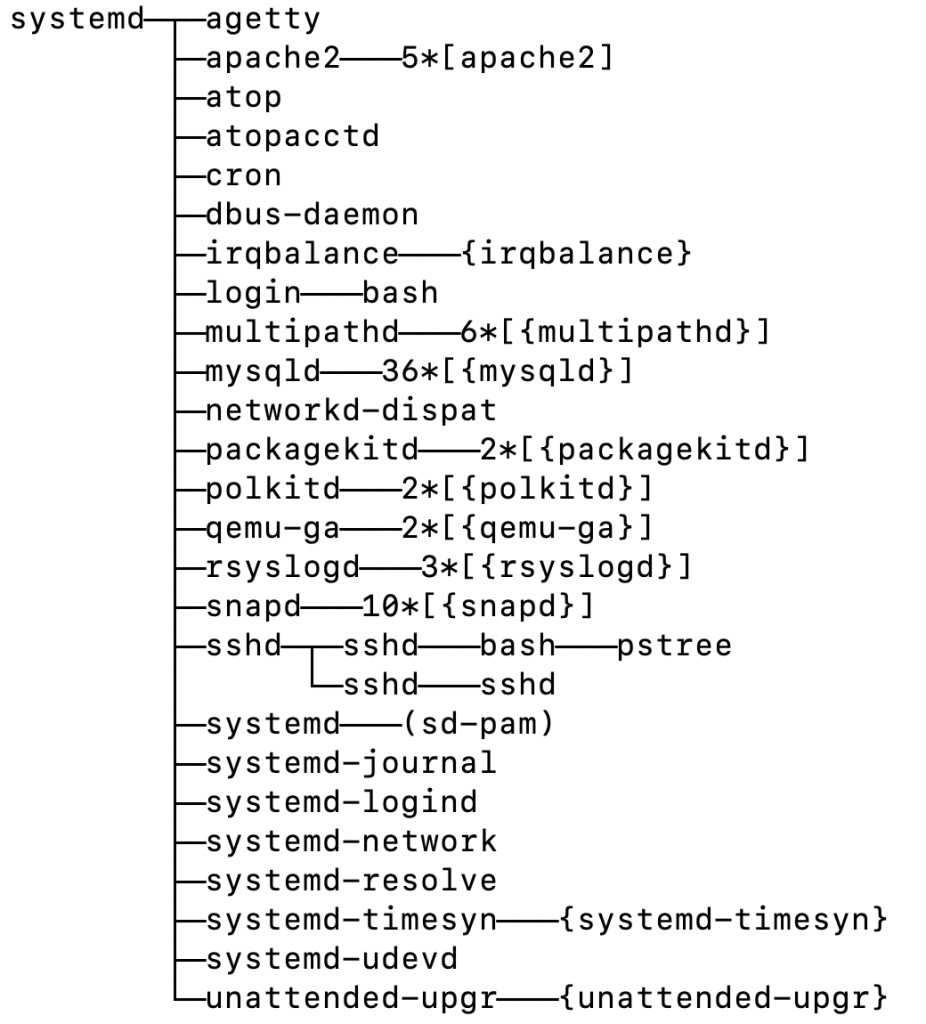
The pstree command helps visualize the process hierarchy in Linux. Instead of listing processes in a flat format like ps or top, pstree organizes them into a tree structure that displays parent-child relationships between processes.
This hierarchy makes it easier to understand how processes are related. For example, system services that launch other processes will appear at the top of the tree, with their child processes indented underneath.
Like htop and atop, pstree isn’t always preinstalled on every distribution. You can install it with:
sudo apt install psmisc # Ubuntu or Debian
sudo dnf install psmisc # CentOS, RHEL, or Fedora
After installation, run pstree to visualize the process tree. Here’s the expected output:
You can use various options with pstree to see additional details:
- -p – process IDs alongside each process name.
- -u – usernames of the processes’ owners.
- -h – currently running process for easier identification.
- -a – full command lines, giving more context for each process.
Managing processes in Linux
After identifying active Linux processes, the next step is to manage them effectively. This includes stopping, killing, or adjusting the priority of processes to maintain optimal system performance.
To stop or pause processes, you can run the jobs command to list background tasks and bring them back to the foreground if needed. For example, use fg to bring a task to the foreground, where <job_number> refers to the number of the background task:
jobs

fg <job_number>
To terminate a process, use the kill command and specify the PID. For instance:
kill <PID>
If you want to stop all processes with the same name, execute killall instead:
killall process_name
For finer control over system performance, you can adjust process priority using the renice command, which changes a running process’ priority value. Lowering this value gives a process higher CPU priority, while increasing it reduces the priority.
The basic syntax is as follows, where <priority> is the new value assigned to the process:
renice <priority> <PID>
Conclusion
Monitoring Linux processes is essential for maintaining system health and optimizing performance. In this article, we’ve explored commands like ps, top, htop, atop, and pstree, which help you list and monitor running processes.
By using these commands, you can ensure that your system remains efficient and responsive. Additionally, make regular process monitoring part of your routine to address any potential issues quickly.
If you still have questions or want to share additional tips for process management, feel free to leave a comment below.
List Linux processes FAQ
What command lists processes in Linux?
You can list processes in Linux using commands like ps, top, htop, atop, and pstree. Each provides a different output format, from static snapshots (ps) and real-time monitoring (top and htop) to historical logging (atop) and process hierarchy views (pstree).
How do I see all running processes?
To see all running processes, use the ps aux command, which lists processes from all users. Alternatively, use the top or htop commands for a real-time view of process activity, including memory and CPU usage.
How do I check memory usage per process in Linux?
Use the top or htop commands to view the memory usage percentage for each process as it happens. You can also run ps aux –sort=-%mem to list processes sorted by memory consumption.

Ariffud is a Technical Content Writer with an educational background in Informatics. He has extensive expertise in Linux and VPS, authoring over 200 articles on server management and web development. Follow him on LinkedIn.