The netstat command in Linux
netstat (short for network statistics) is a command-line tool for monitoring network connections, diagnosing issues, and gathering important network-related data. Available on Linux, Windows, and macOS, it provides real-time insights into active TCP and UDP connections, listening ports, routing tables, and network interfaces.
While modern Linux distributions have moved on to ss (socket statistics) due to its faster performance and more detailed output, netstat is still useful for troubleshooting network problems and performing security analysis.
In this article, we’ll cover everything you need to know about the netstat command in Linux, from syntax and options to practical examples. By the end of this guide, you’ll understand how to use netstat effectively to manage network activity on your system.
netstat command syntax
The basic syntax of the netstat command is:
netstat [options]
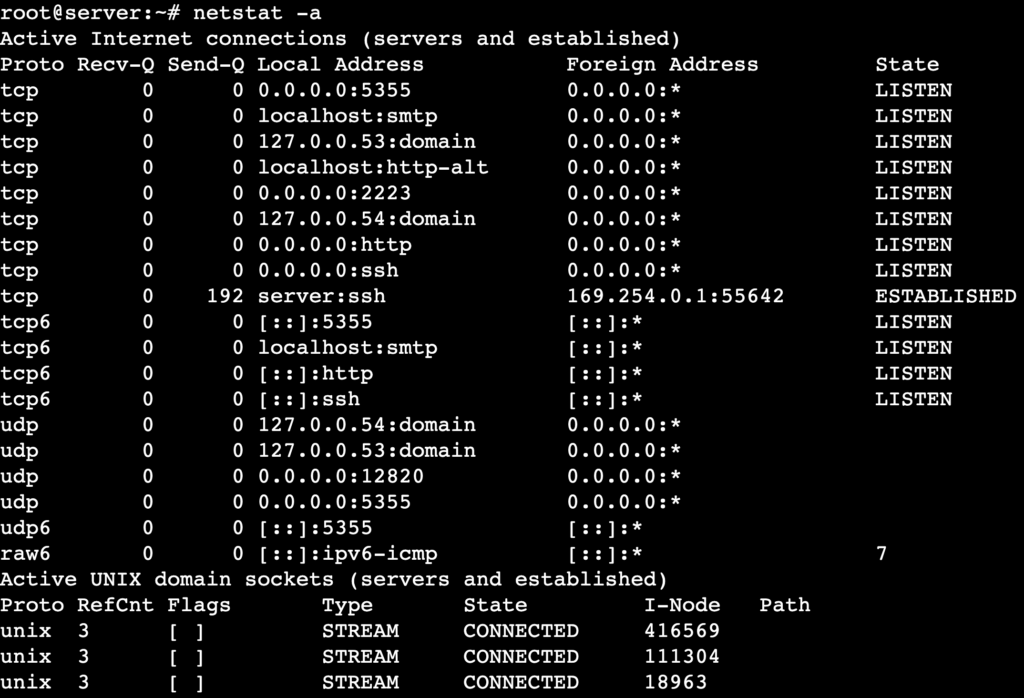
Running netstat without options will display a list of active network connections and socket statistics like this:
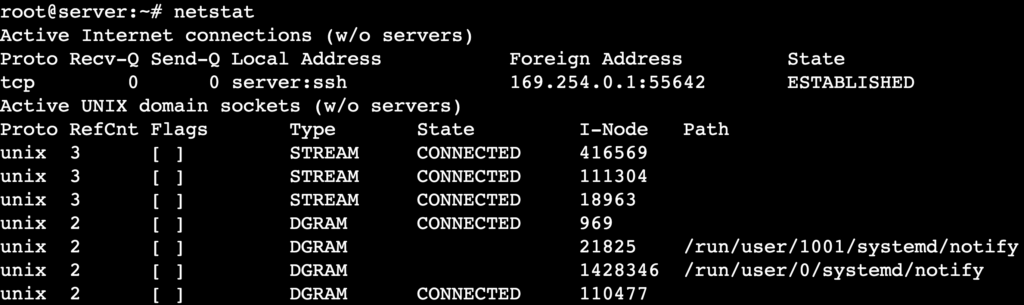
The first section of the output shows active connections with six columns:
- Proto – displays the protocol used (TCP or UDP).
- Recv-Q – shows the number of bytes received that are waiting to be processed.
- Send-Q – indicates the number of bytes in the send queue waiting for transmission.
- Local Address – displays the IP address and port number of the machine.
- Foreign Address – shows the remote system’s IP address and port number connected to the machine.
- State – indicates the connection status, such as LISTEN, ESTABLISHED, or TIME_WAIT.
Meanwhile, you’ll see UNIX domain statistics in the second section, which include:
- Proto – specifies the protocol in use.
- RefCnt – shows the reference count of the socket.
- Flags – displays the socket flags, such as ACC (accept) or W (writeable).
- Type – indicates the socket type, such as STREAM, DGRAM, or SEQPACKET.
- State – shows the current state of the socket.
- I-Node – represents the inode number associated with the socket.
- Path – displays the file system path for the socket, if applicable.
netstat command options
Like most Linux commands, netstat provides several options to customize its output. Here are some of the most commonly used options:
| Option | Description |
| -a | Displays all active connections, including both listening and non-listening sockets. |
| -l | Lists only listening sockets. |
| -t | Shows only TCP connections. |
| -u | Displays only UDP connections. |
| -r | Shows the system routing table. |
| -p | Displays the process ID (PID) and program name associated with each connection. |
| -n | Shows numerical addresses instead of resolving hostnames. |
| -s | Displays protocol statistics for TCP, UDP, and other supported protocols. |
| -i | Lists network interfaces and their statistics. |
| –version | Checks the installed netstat version on the system. |
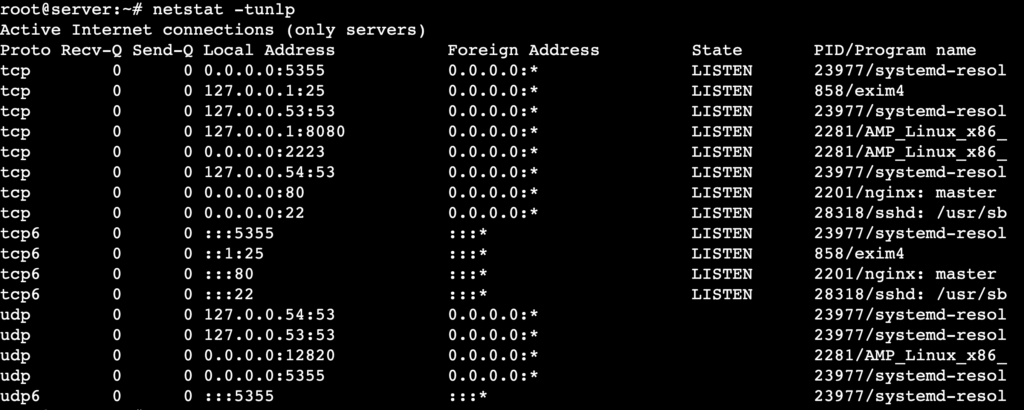
You can also combine multiple options to filter specific details. For instance, to list all listening TCP and UDP connections with numerical addresses and associated processes, type:
netstat -tunlp
netstat command examples
Unlike other network monitoring tools like telnet, which you need to install manually on Linux, netstat comes preinstalled on many distributions, so you can start executing commands immediately in the terminal.
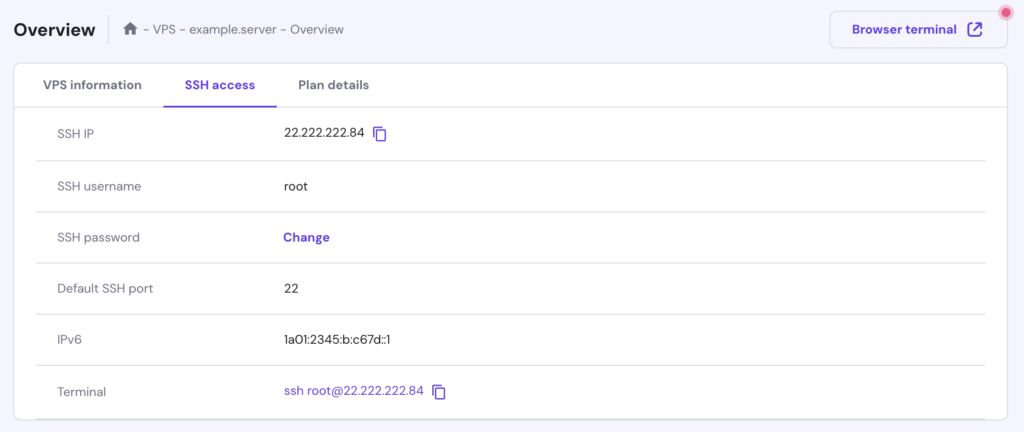
If you want to use netstat on your Linux virtual private server (VPS), make sure you have SSH access to your server. Hostinger VPS customers can find their SSH credentials in hPanel by going to VPS → Manage → SSH access.
We also provide a Browser terminal feature to run commands directly in a browser tab without additional terminal software. To access this feature, click the button in the top-right corner of your VPS dashboard.

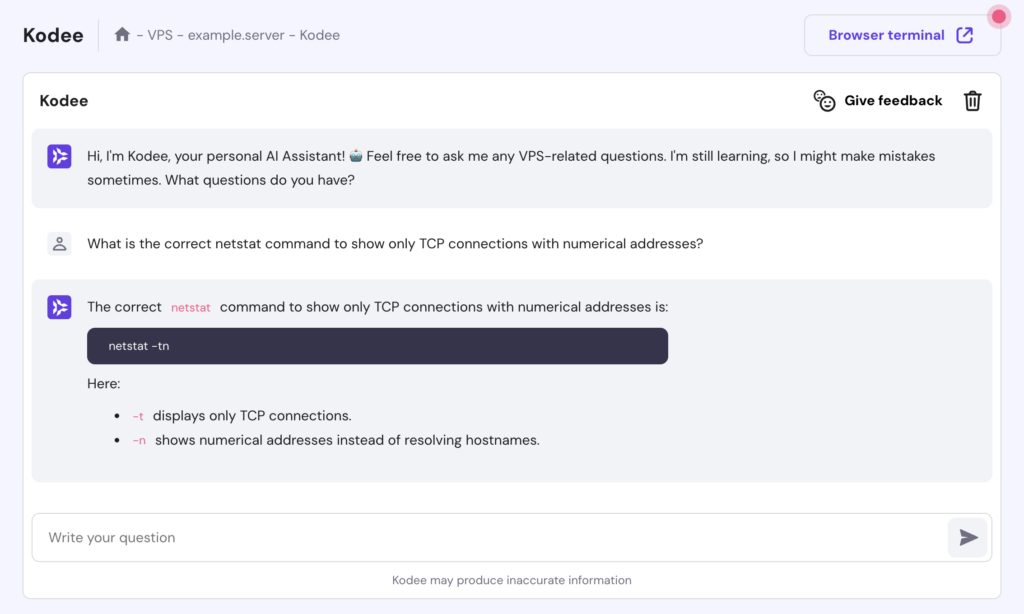
Additionally, Kodee AI Assistant can help you find the correct commands for specific tasks. Simply select Kodee AI Assistant from your VPS dashboard’s left sidebar, type your prompt, and Kodee will suggest the appropriate command along with an explanation.
View all active connections
The netstat -a command displays all active network connections, including listening and non-listening sockets. It helps diagnose network activity, open ports, and potential security risks by identifying unexpected connections.
Run the following command:
netstat -a
For example, if a connection’s state is ESTABLISHED, it means an active two-way communication exists between your machine and a remote system. If it’s LISTEN, the port is open and waiting for incoming connections.
Check TCP connections
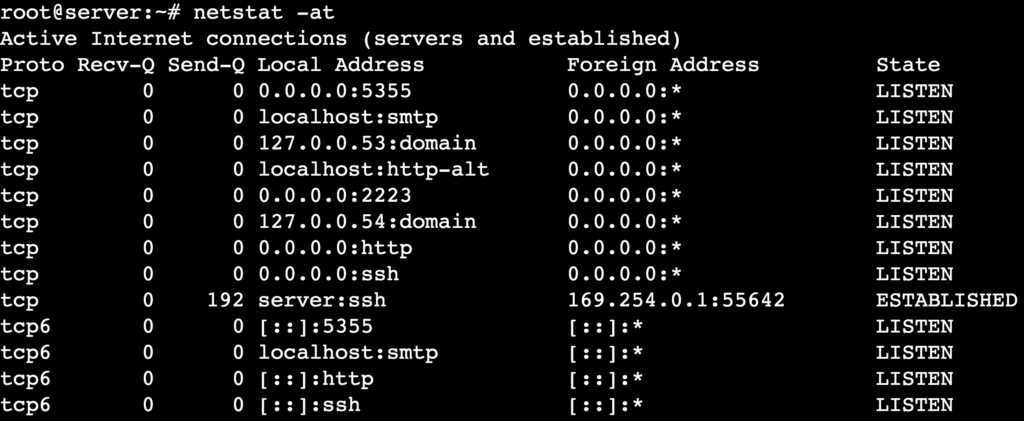
If you want to view only active Transmission Control Protocol (TCP) connections, use netstat with the -a and -t options. This lets you quickly identify issues affecting TCP-based services such as web servers, SSH, and database connections.
netstat -at
If you notice many ESTABLISHED connections, it may indicate a high load on a specific service or an ongoing attack. Meanwhile, multiple TIME_WAIT or CLOSE_WAIT states show that the server struggles to close connections properly, which can lead to resource exhaustion.
List all UDP connections
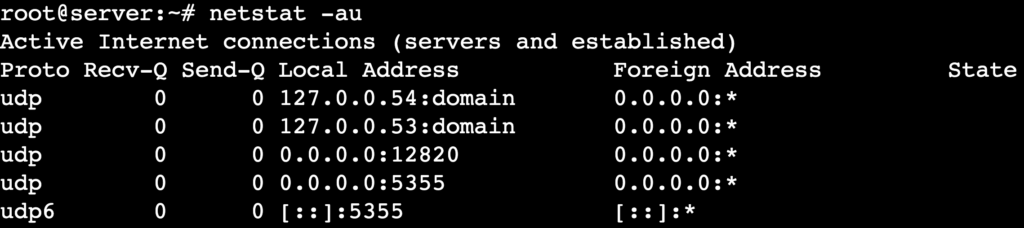
Monitoring User Datagram Protocol (UDP) connections helps identify packet loss, high latency, or unexpected traffic. To filter the output and display only UDP-based network activities, including both open and connected UDP ports, use this command:
netstat -au
Since UDP is a connectionless protocol, the output doesn’t include values in the State column, unlike in the previous example that shows active TCP connections.
The difference between TCP and UDP
TCP establishes a connection before transmitting data for reliable and error-free communication, which is ideal for web browsing, file transfers, and email. In contrast, UDP sends packets without requiring a handshake, making it faster but less reliable, which suits low-latency applications like DNS lookups and VoIP.
Show numerical addresses
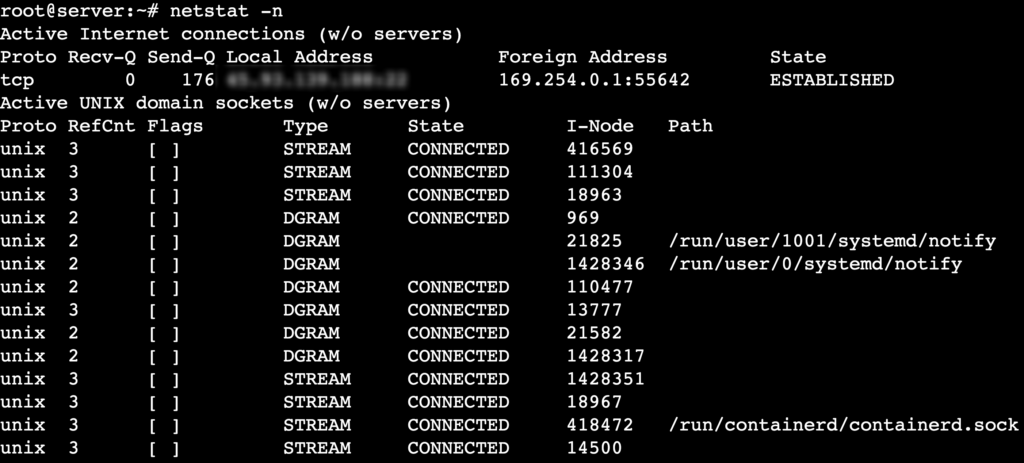
By default, netstat resolves hostnames into human-readable domain names, which can slow down command execution on networks with numerous connections. To disable hostname resolution and display numerical IP addresses, add the -n option:
netstat -n
When executed, netstat displays connections in numerical form, such as 192.168.1.100:443 instead of example.tld:443. This is useful when analyzing local and foreign addresses in active connections, as it provides a faster and clearer view of network activity.
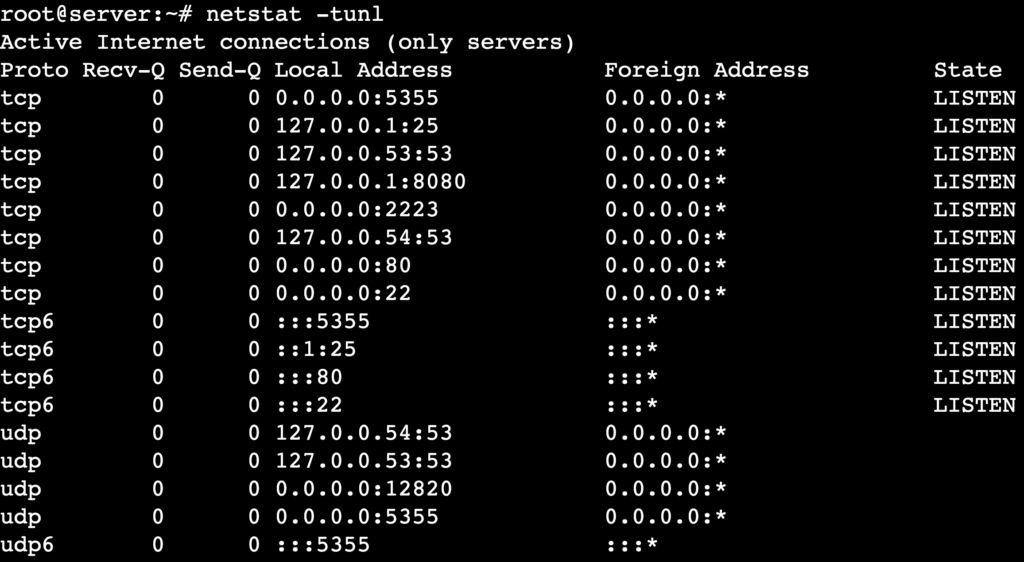
Display listening ports
You can identify which services are actively listening for incoming connections on all open ports by executing:
netstat -l
The output displays only sockets in the LISTEN state, meaning they are actively waiting for incoming connections.
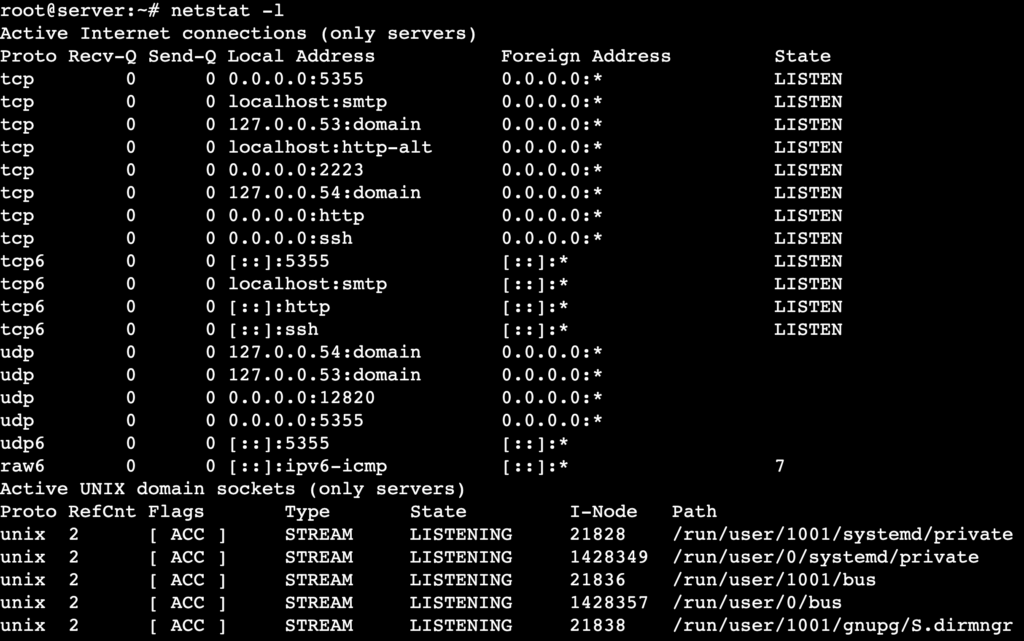
For more filtered results, combine the -l option with -t for TCP or -u for UDP-only connections:
netstat -lt # Show only listening TCP ports
netstat -lu # Show only listening UDP ports
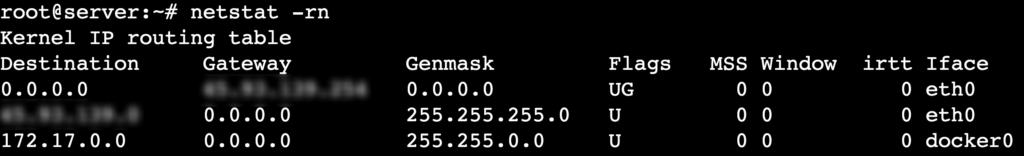
Analyze routing tables
The netstat -r command examines how your system routes network traffic.
netstat -r
It provides details such as destination networks, gateways, and interface information.
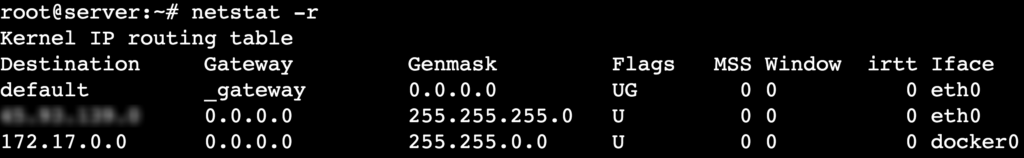
Here’s what each column in the output represents:
- Destination – the target network or IP address.
- Gateway – the next hop for reaching the destination.
- Genmask – the subnet mask defining the network range.
- Flags – indicators such as UG (Up, Gateway) or U (Up, direct route).
- MSS – the maximum segment size (MSS) for TCP connections on the route.
- Window – the maximum TCP window size for the route.
- irtt – the initial round-trip time (RTT) for TCP connections, measured in milliseconds.
- Iface – the network interface handling the route.
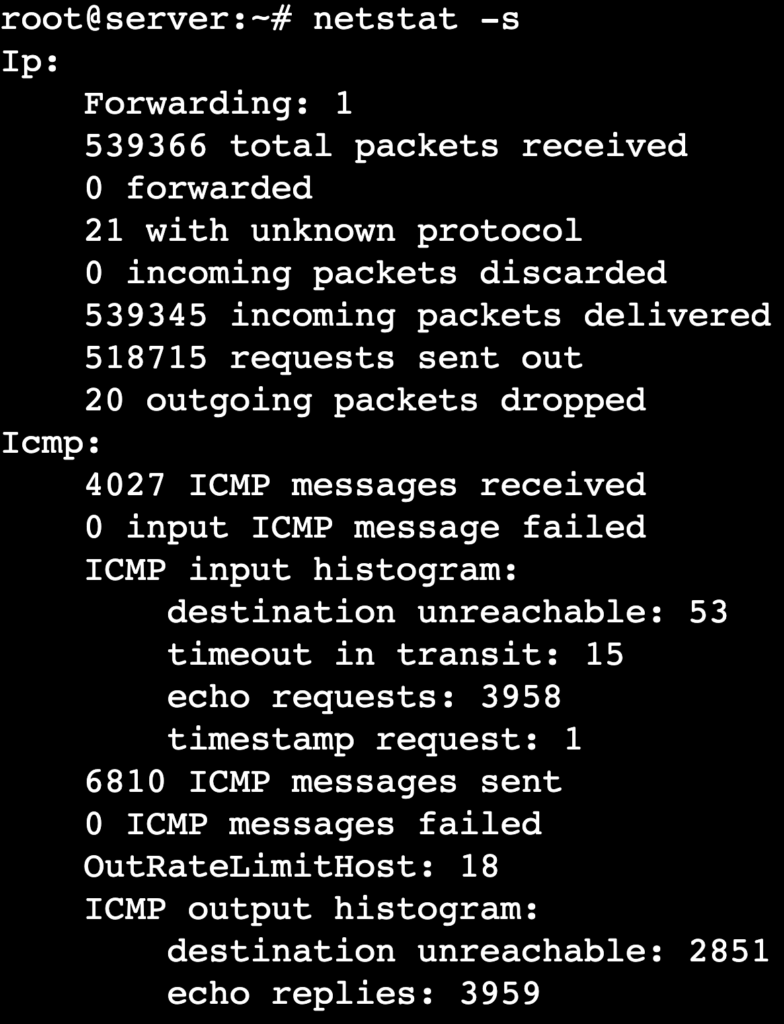
Identify protocol statistics
Using netstat with the -s option, you can find detailed statistics for different network protocols, including TCP, UDP, ICMP, and IP. This is beneficial for identifying packet loss, transmission errors, and dropped connections.
netstat -s
The output organizes statistics by protocol. For instance, TCP stats include values for active connections, retransmissions, and dropped packets, while UDP stats show details on datagrams received, sent, or discarded.
Pro tip
When troubleshooting network issues with netstat -s, look for:
Find connections associated with a specific program
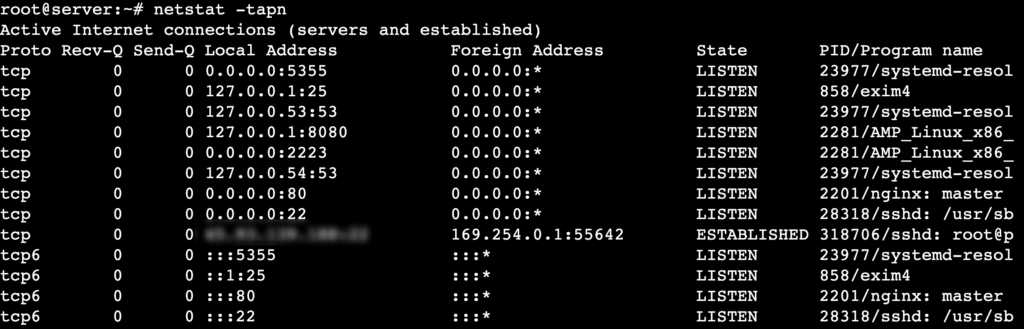
To identify which program owns a network connection, use the netstat -pt command. This displays active TCP connections along with the process ID (PID) and associated program name, helping you monitor running applications and detect suspicious activity.
netstat -pt
You should see the PID/Program name column on the far right of the output, as shown below:
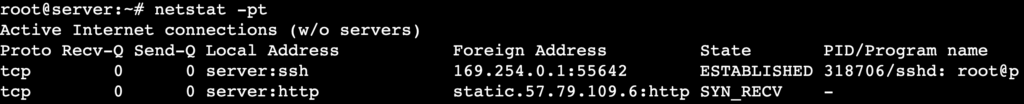
Here, 318706 is the PID, while sshd is the program associated with the connection.
If multiple connections share the same PID, a single application handles more than one session. Additionally, a dash (–) in the column indicates netstat couldn’t retrieve the program name, usually due to permission restrictions.
Filter output with options
As previously explained, you can refine netstat output and focus on specific details by combining multiple options. Filtering out unnecessary data makes troubleshooting more efficient and helps pinpoint network issues faster.
Here are a few useful combinations:
- List all listening TCP and UDP ports with numerical addresses:
netstat -tunl
- Display all active connections along with PIDs:
netstat -tapn
- Analyze routing tables with numerical addresses:
netstat -rn
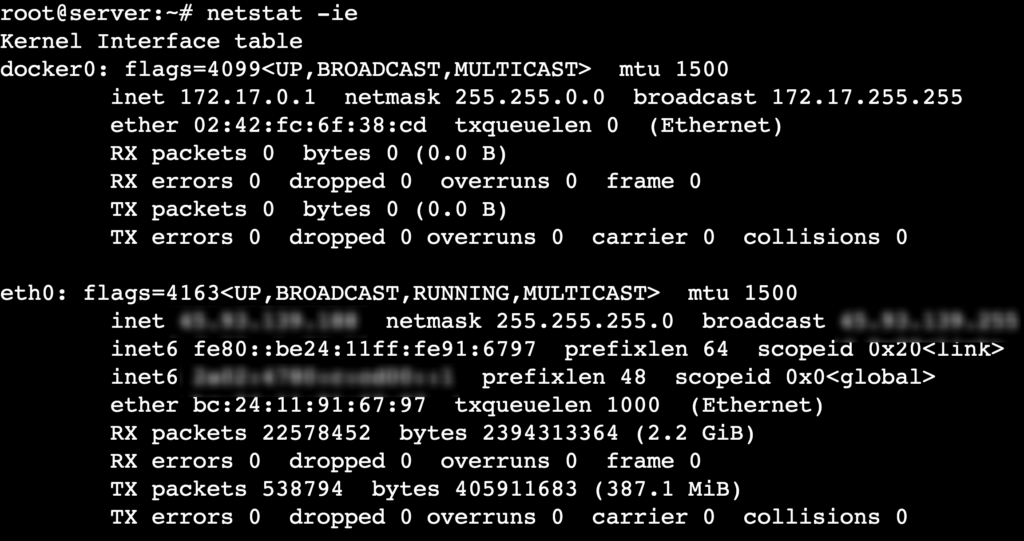
- Monitor network interfaces and their statistics:
netstat -ie
Use netstat with other commands
Besides combining multiple options to filter specific details, you can pipe netstat output to other command-line tools like grep, awk, and wc. This helps extract relevant network data and present it in a more readable format.
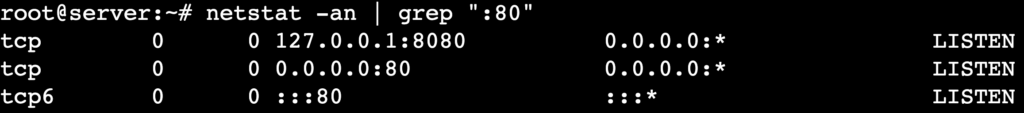
- Filter connections by port number:
netstat -an | grep ":80"
Here, grep filters and displays only connections related to port 80 (HTTP).
- List only listening connections:
netstat -an | grep LISTEN
This filters the results to show only ports in the LISTEN state.

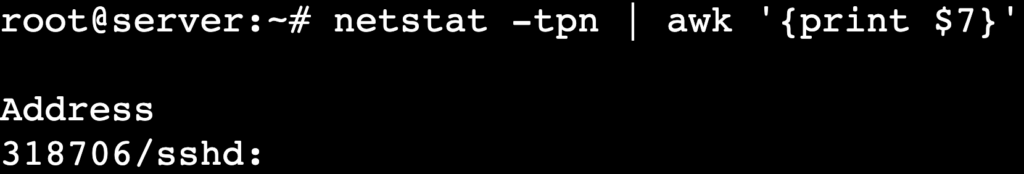
- Extract PIDs associated with connections:
netstat -tpn | awk '{print $7}'
In this command, awk extracts the 7th column containing PIDs and program names.
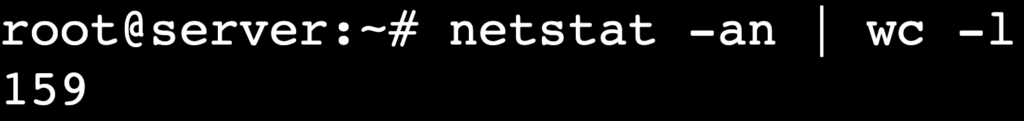
- Count the number of active connections:
netstat -an | wc -l
wc -l counts the total number of currently active connections.
Conclusion
The netstat command is a powerful tool for monitoring network-related information on various operating systems, including Linux. In this article, we’ve explored its syntax, common options, and real-world use cases, such as displaying protocol statistics, listing active connections, and analyzing routing tables.
By experimenting with different options and combining netstat with other commands like grep and awk, you can gain deeper insights into network activity and diagnose issues more effectively.
However, netstat has been deprecated in some recent Linux distributions. While it’s still useful for simple tasks, we recommend using ss (for socket statistics) and ip route (for routing analysis) as modern alternatives, as they offer faster performance and more detailed output.
If you have any questions about netstat or want to share your experience using it – or switching to alternative tools – let us know in the comments below.
netstat command FAQ
What does the netstat command do?
The netstat command monitors network connections, displays routing tables, and provides protocol statistics. System administrators use it to diagnose connectivity problems, find open ports, and analyze traffic flow on Linux, Windows, and macOS.
How do I use the netstat command?
To use the netstat command, open a terminal window and type netstat. This displays active connections and socket statistics. You can add options for more detailed output, such as -t to list TCP connections and -l to show only listening ports.
How is netstat different from the ss command?
The ss command is a faster alternative to netstat, providing more detailed socket statistics with lower resource usage. Unlike netstat, ss retrieves real-time data directly from the kernel. Many modern Linux distributions have deprecated netstat in favor of ss for better performance and accuracy.

Ariffud is a Technical Content Writer with an educational background in Informatics. He has extensive expertise in Linux and VPS, authoring over 200 articles on server management and web development. Follow him on LinkedIn.